Central Bank tightening policies have escalated during the past month, and rising interest rates are impacting asset prices.
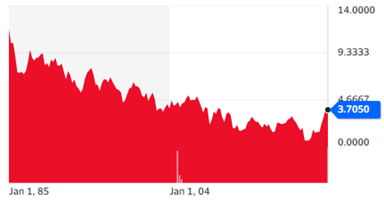
The following chart displays interest rate movements in the US 10 Year Bond over the past 40 years, a long-term downward trend. The US 10 Year Bond Yield is the most actively traded interest rate vehicle in the world and generally considered the best indicator of the future direction of global interest rates. The long-term trend has been downward.
US 10-Year Treasury Yield (40-year chart)

Source: Yahoo Finance
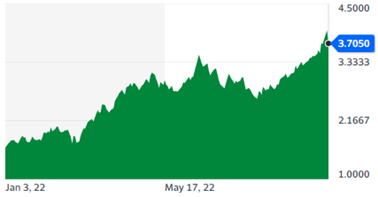
This trend has reversed in the past year, with rates rising at an unprecedented rate, from 1.6% to 3.7%, or a movement of 130%.
US 10-Year Treasury Yield (1-year chart)

Source: Yahoo Finance
The intention is to crush inflation by impacting the demand side of the equation, although much of the inflation seems supply-side related, driven by things such as energy prices, labour shortages and disrupted supply chains.
Asset prices have been impacted, with equity index movements since January as follows:
- S&P 500: -24%
- NASDAQ: -32%
- ASX 200: -13%
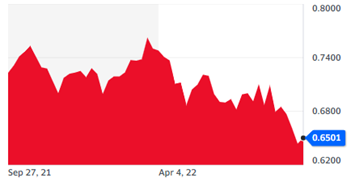
Investors have been gravitating to ‘safe haven’ investments, including the US Dollar.
AUD/USD (1-year chart)

Source: Yahoo Finance
Given that the US is the engine-room of the global economy, these movements are significant.
This has impacted risk appetite making it extremely difficult for companies to raise capital and/or list through initial Public Offerings (IPO). In the US 32 new floats have been completed year-to-date compared to 259 floats and 394 SPACS (Special Purpose Acquisition Companies) last year.
These rapid change in the direction of interest rates was not forecast by majority of market “experts”.
We continue to advocate for long-term investors to own quality companies that have seen previous cycles. There is a lot of downside risk priced into the stock market now. Patient investors will be well served to consider that markets have a long history of growing through adversity.
Alex Leyland
